

With SolarWinds® Database Performance Monitor (DPM), the Profiler feature can help you deploy code with confidence by comparing time ranges. Custom timeframes allow you to see if and how query response changed after a new release.
SolarWinds Database Performance Monitor’s Explorer feature makes it easy to see your queries, their performance, and their impact on the database and infrastructure. View CPU utilization alongside query data, so you can quickly determine if queries are running more frequently, taking longer, or perhaps not using an index when they should.
SolarWinds Database Performance Monitor gives you a visual view of overall database health and provides recommendations to make your database run even better.
The Dashboards interface in SolarWinds Database Performance Monitor makes it easy to visualize the thousands of metrics collected about your queries, database, and infrastructure. Dashboards are simple to create and share.
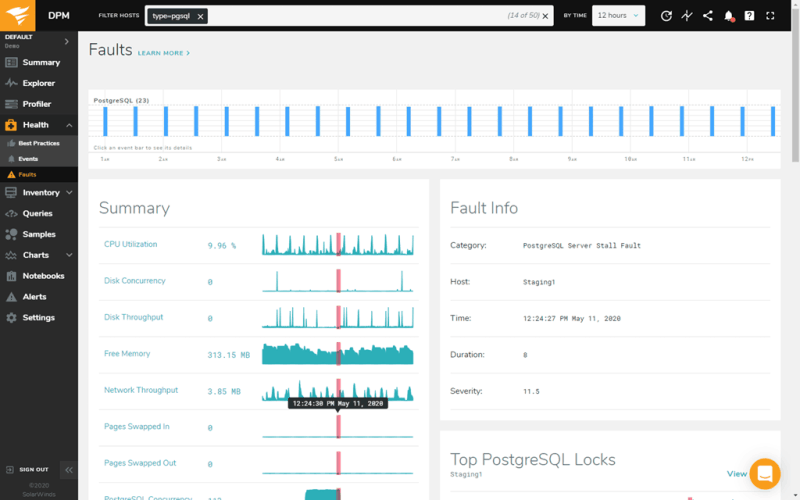
Adaptive fault detection in DPM helps find small interruptions to server or service availability. Finding faults while they’re small can avoid serious outages later.
With DPM, you can filter by query text, host, and timeframe to get a detailed view of a specific query or queries. You can also filter by errors, missing indexes, slow response time, and more to find your worst performing queries.
The combination of events and alerts in DPM ensure you’re aware of any detected or inferred abnormalities to the system, host, queries, and more.